
MITC Analysis
Summary
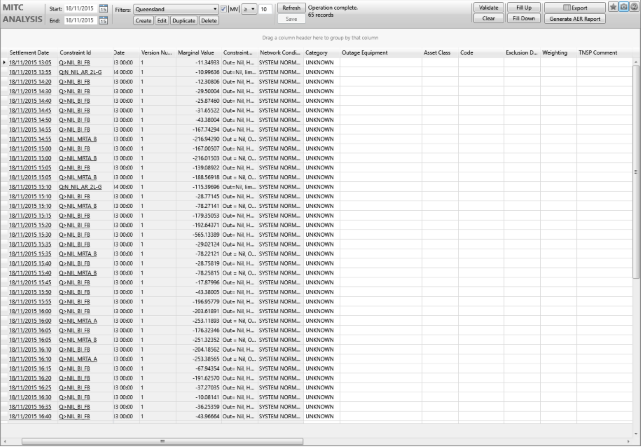
The MITC Analysis widget supports transmission companies in reporting and classifying constraint equations associated with the MITC incentive scheme that is administered by the AER.
Image
Description
The Australian Energy Regulator administers an incentive scheme to encourage transmission companies to manage and minimise the Market Impacts of Transmission Congestion (MITC). Under this program, each transmission company reports on bound constraints that the TNSP has been responsible for during the relevant reporting period.
Using the MITC Analysis widget you can retrieve relevant constraint equations from the database and then annotate these with the details required for MITC reporting to the AER. This data is then stored in an ez2view database for direct access via SQL, or it can easily be export to a CSV file for further analysis in a spreadsheet.
Navigation
You can open the MITC Analysis widget by searching for "MITC" in the ez2view Explorer.
When the widget first opens it will not be populated - you will need to provide a start and end date, and optionally provide a constraint equation filter and/or a marginal value filter and then click "Refresh" for the widget to be populated. See below for more details.
Data Validation
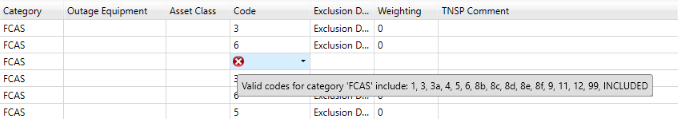
The AER provides a set of data validation rules that the MITC data must meet to be considered valid. The MITC Analysis widget will validate the data displayed in the grid according to the rules outlined in the AER MIC Data Template V7 Category-Code Data Matrix. Any data that does not conform to the AER data validation rules will be highlighted with a red cross. A tooltip providing information about the error will be displayed when you hover over the red cross.
You can initiate validation of the entire MITC grid by clicking the "Validate" button in the tool bar. The data will also be validated each time you edit a row. The data validation error markers can be removed from the grid at any time by clicking the "Clear" button in the tool bar.
Toolbar
From the toolbar you can select the following commands:
- Start and End Dates
- You can specify the date range that ez2view will use to extract data from your MMS database into the MITC Analysis grid. Only dispatch intervals within this date range will be retrieved.
- Filter
- You can choose a Constraint Equation Filter that ez2view will use to extract data from your MMS database into the MITC Analysis grid. Only constraint equations that match this filter will be retrieved. You can use the Constraint Equation Filter Editor to create and edit Constraint Equation Filters
- Absolute Marginal Value
- You can also set an absolute marginal value condition that ez2view will use to extract data from your MMS database into the MITC Analysis grid. Only Constraint Equations matching the absolute marginal value condition will be displayed.
- Refresh
- You use this button to trigger ez2view to run the query and populate the MITC Analysis grid with data from the database.
- Save
- Save the contents of the MITC Analysis grid to the database, including all annotations that you have made to the data (see below). If you have not configured an ez2 database connection then this option will not be available. If you have applied a column filter using the grid header then only the rows visible in the grid will be exported. What you see is what you get.
- Validate
- Evaluates the data in the MITC Analysis grid according to the AER MIC Data Template V7 Category-Code Data Matrix. Any data that does not conform to the data validation rules will be highlighted with a red cross.
- Clear
- Clears all of the validation error markers currently displayed in the grid.
- Fill Up or Fill Down
-
If you have entered data for a row in the MITC Analysis grid, then you can quickly copy this data to other rows immediately
above or below the row. To do this:
- Select the leftmost data cell in the row that you want to replicate.
- Press and hold the shift key on the keyboard.
- Select the rightmost data cell in the row you want to replicate (this should cause all the data cells in the row to become selected).
- Still holding the Shift key down, repeatedly press the Up-Arrow key, or the Down-Arrow key on the keyboard to select the required rows.
- Select "Fill Up" or "Fill Down" from the toolbar as appropriate. This should cause the selected data to be populated into the selected rows. (Note that this operation only copies data you have entered - cells containing AEMO data are not affected).
- Export
- You can export the contents of the MITC Analysis grid to a CSV file, which you can then open in Excel, or use in other applications. All of the data visible in the MITC Analysis grid will be exported.
- Generate AER Report
- Clicking this button will open the MITC AER Report Generation widget. The report widget enables you to easily export your MITC data to a CSV file in a format that is consistent with the AER MIC Data Template V7.
Data Grid
The grid contains one row for each dispatch interval in which a constraint that matches the filter bound (that is where MV != 0).
- Context Menu
- The data grid provides in built functionality to help you manage the data. Right clicking in any header will provide you with a context menu that will enable you to sort, group and search the grid data as well as hide and show columns as required.
- Editing Data
- The data displayed in the grey columns cannot be edited by the user. The data in the white columns can be edited by the user as either a free text field or a drop down box with pre-configured values. When the cell to be edited is highlighted an icon (a downward arrow for a drop down box and a pencil for a free text field) will be displayed to the right of the cell. Clicking the arrow will display the available values in the drop down box. The free text field can be edited directly in the cell or by clicking the pencil icon to open a text editor.
- Copying Data
- You can select multiple rows/columns in the data grid, and use the copy command (Ctrl-C) to copy the data you have selected to the clipboard. You can then paste this data directly into Excel, and it will maintain the column/row structure as expected and copy the column headers. You can also copy the value of a single grid cell into another single cell using the standard copy (Ctrl-C) and paste (Ctrl-V) commands.
- Time Travel
- You can time travel to the dispatch interval in which the constraint equation was bound by clicking on the Settlement Date hyperlink. The time travel dialogue will be displayed allowing you to select which dispatch interval to display.
- Constraint Equation Details
- You can view the details of a specific Constraint Equation by clicking the Constraint Id hyperlink. A Constraint Equation Details widget for the selected Constraint Equation will be opened in a new tab.
The MITC Analysis grid includes the following columns:
| Column | Description |
|---|---|
| Settlement Date |
The dispatch interval in which the constraint equation was bound. Click this link to time travel
to the dispatch interval.
Populated from AEMO data. |
| Constraint Id |
The identifier of the constraint equation that bound. Click this link to open
the Constraint Equation Details widget.
Populated from AEMO data. |
| Effective Date |
Effective date of the constraint equation. This field indicates the version of the constraint equation
that was used in the dispatch interval.
Populated from AEMO data. |
| Version Number |
The version number of the constraint equation. This field indicates the version of the constraint equation
that was used in the dispatch interval.
Populated from AEMO data. |
| Marginal Value |
The marginal value of the constraint in the MCC run for the dispatch interval.
Populated from AEMO data. |
| Constraint Description |
Details of the plant that is not in service.
Populated from AEMO data. |
| Network Condition |
Either "System Normal" or "Outage".
Populated from AEMO data. |
| Category |
Additional categorisation of the network constraint. When possible ez2view Australia will automatically set the initial category
value based on the Constraint Equation ID. If an initial category value cannot be inferred from the Constraint Equation ID,
ez2view will set the category to 'UNKNOWN'.
Populated from AEMO data. User editable. |
| Outage Equipment |
A field in which you can record the details of the equipment involved in the related outage.
User editable. Limited to 255 characters. |
| Asset Class |
Identifies whether the equipment is either a regulated asset or non-regulated asset. If the outage is related to non-regulated assets, exclusion code 4 must be entered.
User editable. |
| Code |
A field in which you can select the AER exclusion and inclusion code for the constraint equation, if one applies.
User editable. |
| Exclusion Detail |
A field in which you can record any details on the exclusion claim (i.e. reference to supportive evidence, or outage details).
User editable. Limited to 1024 characters. |
| Weighting |
A field in which you can attribute the weighting for the outage.
User editable. |
| TNSP Comments |
A field in which you can record any comments that you may have about this constraint equation.
User editable. Limited to 2000 characters. |
| OMS ID |
A field in which you can record your Outage Management System identifier for the outage related to this constraint equation.
Populated from AEMO data. User editable. Limited to 255 characters. |
| Outage Type |
A field in which you can select "Planned" or "Unplanned" as the outage type. The default value is blank.
User editable. |
| Constraint Set ID |
The identifier of the constraint set that the bound constraint belongs to. Click this link to open the
Constraint Set Entity Browser.
Populated from AEMO data. |
| Impact |
The device(s) that is affected by the constraint e.g. Interconnector, Generator(s) or Cutset.
Populated from AEMO data. |
| Reason |
The contingency or reason for the constraint.
Populated from AEMO data. |
| Limit Type |
The limit type of the constraint e.g. Transient Stability, Voltage Stability.
Populated from AEMO data. |
| Region |
Derived from Constraint ID. AEMO use a naming convention when formulating the identifiers for constraint equations (the Constraint ID). The first characters of the naming convention identify the Region, or other special conditions, to which the constraint equation applies. Derived by ez2view Australia using the Constraint ID. |
| Source |
The source of the constraint formulation.
Populated from AEMO data. |
| Additional Notes |
Extra notes on the constraint.
Populated from AEMO data. |
| Constraint Type |
The logical operator (=, >=, <=).
Populated from AEMO data. |
| Generic Constraint Weight |
The constraint violation penalty factor.
Populated from AEMO data. |
| Modifications |
Details of the changes made to this version of the constraint.
Populated from AEMO data. |
Database Access to MITC Data
You may wish to access your MITC data directly using SQL. If so, you can use the details below to access the database.
The Installation Instructions for ez2view describe how ez2view should be installed so that a database table is created to store your MITC data. You will need to follow these instructions to save MITC data that you enter on the MITC Analysis widget into this table.
The ez2view installation script will create a table called MITC_RECORD within a database that is named by you (or by your IT staff). You will need to know the database name, and have credentials to access this database if you are to query your MITC data directly.
Notes
The MITC Analysis widget Uses MCC_CONSTRAINTSOLUTION
Note that the AEMO data that is displayed in the MITC Analysis widget is taken from the MMS table named MCC_CONSTRAINTSOLUTION. The data in this table is relevant for MITC, but may be different from the constraint equation data that is displayed in other widgets in ez2view. The MCC_CONSTRAINTSOLUTION data reflects constraint equation marginal values from the marginal constraint cost (MCC) re-run, described by AEMO as follows:
This re-run relaxes (slightly) any violating constraint equations as well as any constraint equations with a marginal value equal to the constraint equation�s CVP x market price cap (MPC) (for example 200000 or 3600000). For the purposes of the calculation the marginal value in each dispatch interval is capped at the MPC valid on that date (MPC was increased to $12,900 on 1st July 2012).
AEMO : Monthly Constraint Report : October 2012
All ez2view Users can Read and Write the MITC Table
ez2view does not control which users can read from or write to the MITC database table. If you would like to implement access controls to the data then there are instructions for doing this in the Installation Instructions for ez2view.