
Bid Properties Tables
Summary
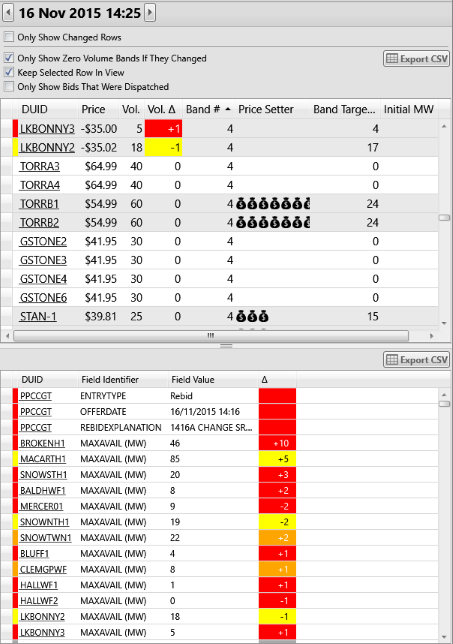
The two tables on the right of the Bids and Offers screen contain details of bids or offers. The top table contains the bid stack merit order, and the lower table displays other attributes of the bids or offers (availability, ramp rates, and the like). The tables highlight any changes in values between the displayed dispatch interval, and the previous dispatch interval.
Image
Description
The two tables on the right of the Bids and Offers screen contain details of bids or offers. The top table contains the bid stack merit order, and the lower table displays other attributes of the bids or offers (availability, ramp rates, and the like). The tables highlight any changes in values between the displayed dispatch interval, and the previous dispatch interval.
Controlling the Contents and Behaviour of the Tables
The controls at the top of the right hand panel are used to control the contents and behaviour of the tables.
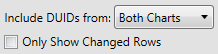
- Include DUIDs from Top / Bottom / Both:
- Depending on the screen configuration that you have chosen on the Bids and Offers screen you may have the option of choosing which chart or charts are used as the source of the DUIDs with which to populate the tables.
- Only Show Changed Rows
- ez2view will highlight values that change from one dispatch interval to another using color, as explained on this page. If you check this box, then ez2view will restrict the contents of the tables to only those rows that have changed since the last dispatch interval.
The Bid Stack Merit Order Table
The upper table has controls for its behaviour and contents.
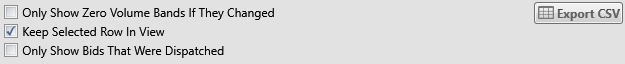
- Only Show Zero Volume Bands If They Changed
- An offer can contain zero volume at any particular price band. If you check this box, then ez2view will remove all rows from the table that have zero volume at that price band, except those rows that have changed (i.e. had volume removed) since the last dispatch interval.
- Only Show Bids That Were Dispatched
- If you check this box, then ez2view will remove all rows from the data grid that were not dispatched in the selected dispatch interval.
- Keep Selected Row In View
-
The table will refresh itself as you move from one dispatch interval to the next. This checkbox allows you to control
which rows are brought into view when this refresh of the display occurs.
If you select this check box, then the row with the focus will be automatically brought into view. This is useful if you are watching a particular price point, or unit.
If you leave this check box unselected, then the table will move to the top on each refresh. This is useful if you are tracking what changed from one dispatch interval to the next. In this case you will probably also want to sort the table by the Delta column, by clicking that column header.
- Export CSV
- You can export the contents of the table to a CSV file, which you can then open in Excel, or use in other applications.
The Bid Stack Merit Order Table contains one row for each price band, and includes the following columns:
| Column | Description | ||||
|---|---|---|---|---|---|
| DUID | The DUID making the offer. | ||||
| Price | The dollar value of the price band (normalised to account for transmission and distribution loss factors). | ||||
| Volume | The number of megawatts offered at that price band (accounting for availability and fixed load). | ||||
| Delta | The difference between the volume offered at this price in the current dispatch interval when compared with the immediately previous dispatch interval. | ||||
| Band | The number of the price band within the offer. | ||||
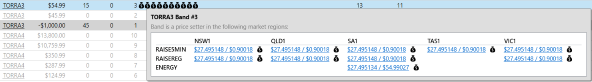
| Price Setter |
An icon is displayed in the Price Setter column when the band contributed to setting the published market price for Energy or an Ancillary Service in a region. The number of
icons displayed indicates the number of market region prices the band was a price setter for.
|
||||
| Band Target MW | Target MW for the price band at the end of the dispatch interval. | ||||
| Initial MW | Initial MW at the start of the dispatch interval. |


The Bid Attributes Table
The Bid Attributes Table contains one row for each attribute of each bid or offer. Subject to the filters you have applied, in this table you can see the details of all the offers that apply in the current dispatch interval, regardless of when that offer was submitted by the generator. This table includes the following columns:
| Column | Description |
|---|---|
| DUID | The DUID making the offer. |
| Field Identifier | The name of the field from the offer that is being displayed in this row. The units of measure for the field are shown in brackets after the field name. |
| Field Value | The value for the field in the offer. |
| Delta | The difference between the value of the field in the current dispatch interval when compared with the immediately previous dispatch interval. |
The following offer fields are displayed in the table, and their descriptions below are taken from the AEMO MMS Data Model version 4.18 dated 31 May, 2012.
| Field Identifier | Description |
|---|---|
| DAILYENERGYCONSTRAINT | Maximum energy available from Energy Constrained Plant. (Energy Bids Only). |
| MAXAVAIL |
Maximum availability for this BidType in this period
[Note: We refer to "BidType" as "Product" i.e. "Energy" or an Ancillary Service] |
| MINIMUMLOAD | Minimum MW load fast start plant |
| OFFERDATE | Offer date and time |
| REBIDEXPLANATION | Explanation for all rebids and inflexibilities |
| ROCDOWN | MW/Min for lower (Energy Bids Only) |
| ROCUP | MW/min for raise (Energy Bids Only) |
| ROCUP | MW/min for raise (Energy Bids Only) |
| T1 | Time to synchronise in minutes (Energy Bids Only) |
| T2 | Time to minimum load in minutes (Energy Bids Only) |
| T3 | Time at minimum load in minutes (Energy Bids Only) |
| T4 | Time to shutdown in minutes (Energy Bids Only) |
| ENABLEMENTMIN | Minimum Energy Output (MW) at which this ancillary service becomes available (AS Only) |
| ENABLEMENTMAX | Maximum Energy Output (MW) at which this ancillary service can be supplied (AS Only) |
| HIGHBREAKPOINT | Maximum Energy Output (MW) at which the unit can provide the full availability (MAXAVAIL) for this ancillary service (AS Only) |
| LOWBREAKPOINT | Minimum Energy Output (MW) at which the unit can provide the full availability (MAXAVAIL) for this ancillary service (AS Only) |
The Selected Interval
The tables display data for a specific dispatch interval. By default the dispatch interval that is used is the current dispatch interval that you set through the Time Travel Controller. However, there are several navigation mechanisms on the Bids and Offers screen that allow you to view the details of bids from other dispatch intervals. This control appears above the tables and indicates which dispatch interval is being displayed in the tables:

This control allows navigation backwards and forwards one interval at a time using the arrows. Clicking the button beside 'AS AT' will set the selected interval back to the current point in time for the ez2view application.
Navigation
Time Travel
Using Time Travel you can step through dispatch intervals (using the Time Travel Controller) to see how the bid stacks evolve over time.
The names of DUIDs are linked to the Station Details