
Station Details
Summary
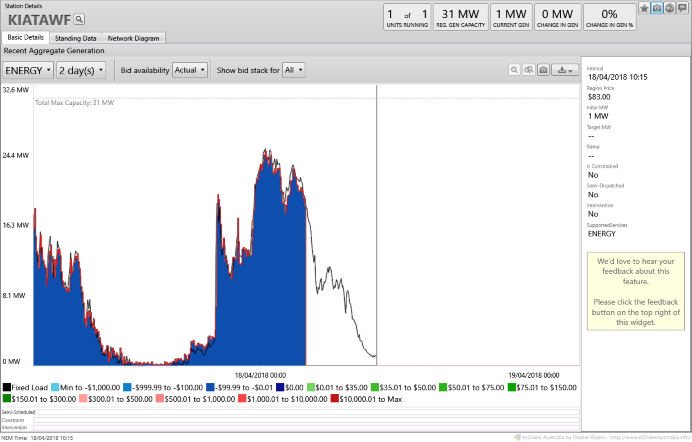
The Station Details widget provides a detailed standalone view of a station in a single widget. The widget provides easy access to current operational and bid data for the station as well as detailed standing data.
Description
The Station Details widget provides a rich view of of the current state of a station in the NEM. When viewed in real time only actual dispatch data is available for the current dispatch interval. Unless you have access to private data via your own INFOSERVER, bid data, target generation and available generation data will not be available for the current day until 4am the day after.
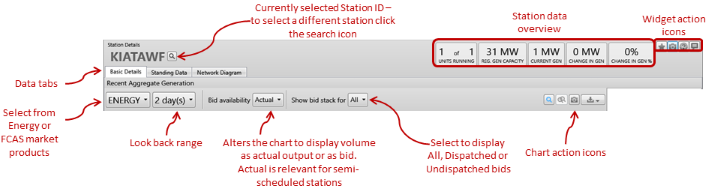
Basic Details
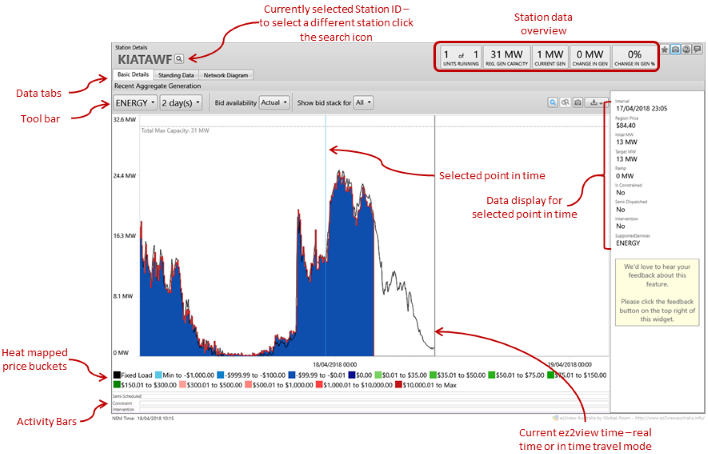
The Actual output value displayed in the chart for the selected station is the sum of the unit Intial MW values for the next dispatch interval. The MW value is then time shifted back 5 min to allow easy comparison between the actual station output value and the dispatch target value for the current interval.
If you have access to private data or you are viewing the Station Details in time travel, the predispatch availability data displayed will depend on the type of station selected.
- Scheduled Generators
- Max availability as bid
- Semi-scheduled Generators
- Predispatch availability as determined by the appropriate forecasting system (AWEFS for wind and ASEFS for solar)
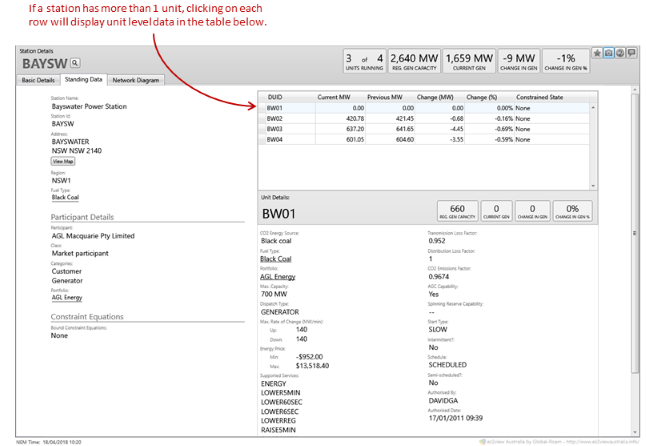
Standing Data
Toolbar
Hornsdale power Reserve has an additonal tool bar options to allow you to switch between the generator and load view of the station. As the only grid level storage in the NEM this feature is only available on the Hornsdale station view.
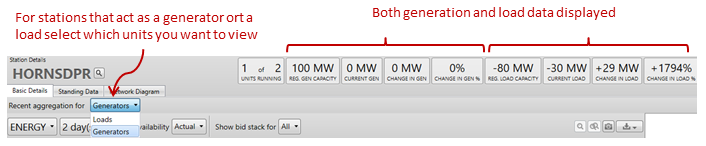
Chart Annotations
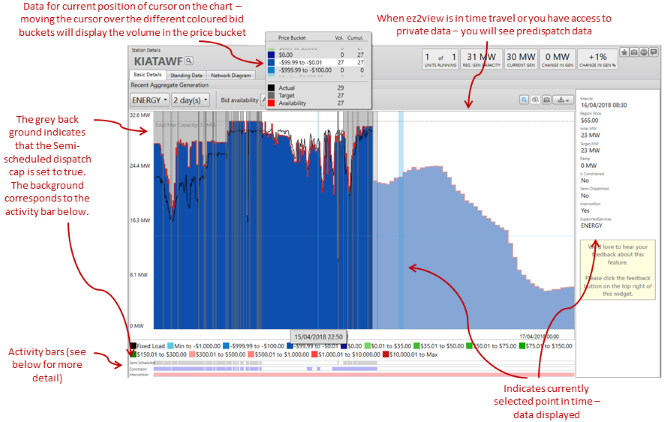
Chart Activity Bars

The activity bar provide greater context about the conditions the station is operating under.
- Semi-Dispatch Cap - grey indicates that the cap is set to 1
- Semi-scheduled generators recieve dispatch instructions comprising of a dispatch target (in MW) and a semi-dispatch cap (either 0/1). If the semi-dispatch cap is set to 1 then the generator must cap their output at or below the dispatch level for the dispatch interval. If the semi-dispatch cap is not set the generator is free to generate at any level. The cap could be trigger by network limitations, inter-regional limitations or bid or market related limitations.
- Constraint - purple indicates that any station unit(s) is on the LHS of a bound constraint
- For more details on bound constraints refer to the Bound Constraint widget help file.
- Intervention - pink indicates that the AEMO has intervened in the dispatch interval
- The AEMO is required to intervene in the market, thus altering the market outcome, to ensure the security and reliability of the power system. The Intervention activity bar indicates when the AEMO has intervened.
Widget Icons

Chart Icons
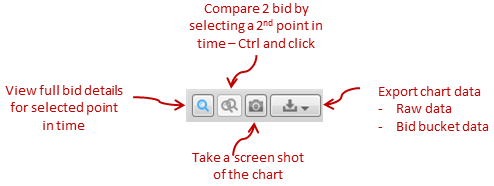
For more information on Bid Details refer to the Bid Details help page.
Export to CSV
You can export the data in the chart to a CSV file. You can either export the data as:
- Raw Data, in which case the file will contain, for each dispatch interval, ten rows for each of the selected units. This file could become quite large if you have a large number of units and/or a large number of days selected.
- Bid Bucketed Data, in which case there will be, for each dispatch interval, one row for each price bucket.