
Constraint Equations
Summary
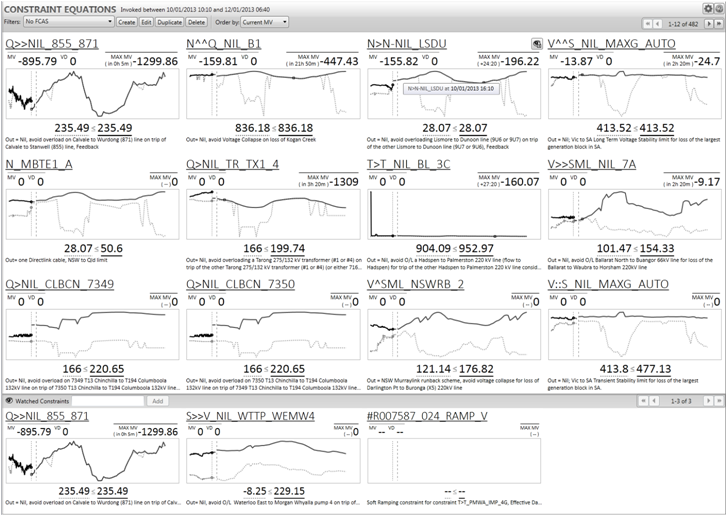
The Constraint Equations screen shows all Constraint Equations that have recently been invoked, are invoked now, or are scheduled to be invoked in pre-dispatch.
Image
Description
The Constraint Equations screen shows details of all Constraint Equations that have recently been invoked, are invoked now, or are scheduled to be invoked in pre-dispatch. The screen is divided into two areas - the top panel is dynamically populated with constraint equations that match your selection criteria, the lower panel is populated with a fixed set of constraint equations that you have specifically selected.
Constraint Equation Charts
Each Constraint Equation is represented by a chart that shows the values for the LHS and RHS of the equation.
The vertical line on the chart represents the current dispatch interval - to the left of this is dispatch history, and to the right predispatch data (five minute predispatch data, followed by thirty minute predispatch data when the five minute data is exhausted).
The chart shows other properties of the constraint equation as indicated by the figure below.
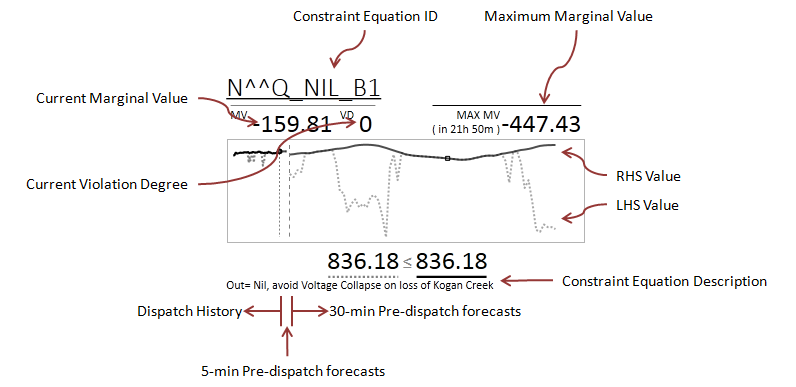
Maximum Marginal Value
ez2view calculates the "maximum marginal value" for constraint equations based on pre-dispatch data. The maximum marginal value for a constraint equation is the largest absolute value for its marginal value property that can be found in the predispatch data.
Upper Panel - Dynamically Populated
The constraints that are displayed in the upper panel are selected by ez2view according to criteria that you provide. There are two aspects of the upper panel that you can control - the first is a Constraint Equations Filter that you can use to select which constraint equations are relevant to you, and the second is the order in which the constraint equations are displayed on the screen.
Constraint Equation Filter
You can filter the constraint equations that appear on the Constraint Equation Screen so that ez2view displays the equations that are most relevant to you. From the "Filters" drop down you can select a filter to apply to the upper panel. You can also create new filters and edit the selected filter - see the Constraint Equation Filter Editor for instructions on creating and editing constraint equation filters.
Constraint Equation Display Order
ez2view orders the display of the constraint equations in the upper panel from left to right, and then top to bottom. You can control the order in which ez2view displays constraint equations in the upper panel using the "Order By" drop down. By default, ez2view uses the absolute value of the current marginal value to perform this ordering. If you select "Maximum MV", ez2view will use the absolute value of the Maximum Marginal Value to perform this ordering. If you are using Maximum Marginal Value, then you can also select a time period that will contrtol how far into the predispatch data ez2view looks to determine the Maximum Marginal Value.
Lower Panel - Statically Populated
The lower panel contains a static set of constraint equations that you have selected. The equations that are displayed in the lower panel do not change as market conditions change. You can add an equation into the lower panel in either of the following ways:
- Type the constraint equation ID into the "Watched Constraints" box, and click "Add". If you use this method, then note that the Add button will be disabled until you have typed a complete constraint equation identifier that matches one that is stored in the database.
- Hover your mouse over a constraint equation chart in the upper panel, and then click the button that apperas in the upper right hand corner of the chart.
To remove a constraint equation from the lower panel, hover your mouse over the constraint equation chart and then click the button that apperas in the upper right hand corner of the chart.
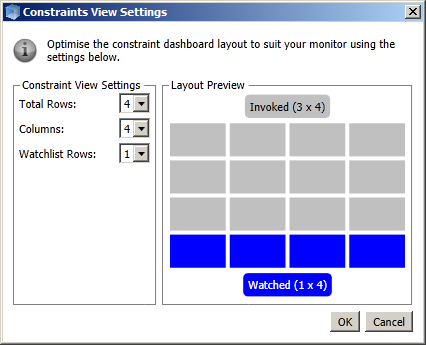
Display Rows and Columns
You can control the number of rows and columns that ez2view displays, as well as the ratio of rows between the upper and lower panel. Click the cog icon at the top right of the screen (next to the Help button) to invoke the Constraint View Settings dialog.
Pages
There are usually more constraint equations invoked in the NEM than will fit on the Constraint Equations panels, and so ez2view provides a paging control that allows you to see how many equations there are, and to move through the pages. The single arrow moves you forwards or backwards by one page, the double arrows take you to the first or last page.

Navigation
The Constraint Equation IDs on the charts are linked to the Constraint Equation Entity Browser
Constraint Equation Filters are edited using the Constraint Equation Filter Editor